Initial Setup
To initially set up your view of the nicos Monitoring Portal, please go through the following steps:
- Change your view to the new UI by activating the button
 on the top
 - Switch the display time from
Any timetoDefaultusing the menu on the top right:
- Click on the funnel icon (filter) and click on Add Record

- Assign
snow.location.nameas Property andLocationas Filter name, and click Apply.
- Save the created view by clicking on the star icon and defining a name like
Default View
Now you have set up your Dashboard View and you can start using it. Read through the following chapters to learn how.
Using The Dashboard
Using the menu on the left, you can navigate to the dashboard
“WAN Service – Site”.


This dashboard shows live monitoring data for all of your nicos managed services. It is intended to be used with applied location-filters, so the displayed data refers to a single location. You have already prepared the necessary location filter during initial setup.
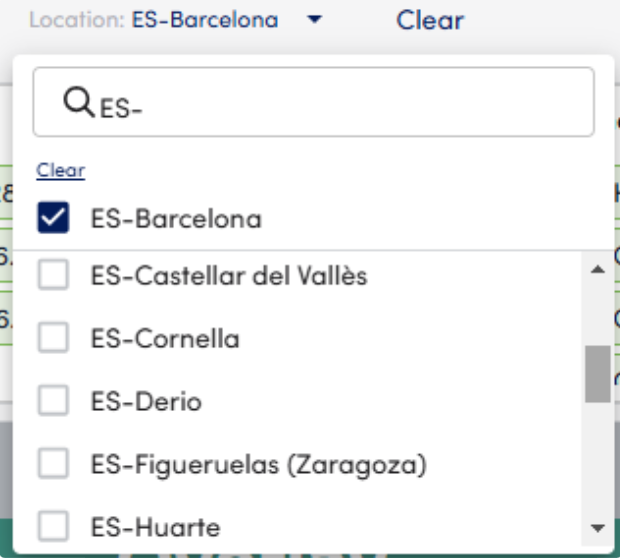
You can filter the dashboard to a specific location by using the Location filter now:

By default not all of your locations may appear in the search list. Just start typing the country code to narrow down the list and you should be able to select your desired location.
Please note: Clicking on Clear on top removes the whole Location-Filter, not just the assigned location. If you just want to clear the selected location, click on the smaller Clear link within the white search window. If you accidently removed the whole Location-Filter, you can restore it by restoring your saved Default View using the Star button.
Changing the Dashboard time
Each dashboard widget has a default time range (typically last 24h). You can adjust this by
changing the time range using the drop-down menu on the top right:
When using the maximize button  on one widget, the time can also be changed for this single widget (drop-down menu on the top-left of the widget).
If you want to narrow down specific time frames within a graph widget, you can just pull a frame with your mouse to zoom in. After doing this, you can revert back to the default time using the undo button  or apply the specific time range to your account (so it gets applied to all widgets) by clicking the apply button
  .
.
Once you applied a specific time range to your account, it remains applied until you change your time using the menu on the top right.

Display graph legends
Use the button  to activate descriptive graph legends. The button on the top activates / deactivates graph legends for the whole dashboard, but you can also change the settings on each single graph widget.
SUPPORT
If you need further support please contact your nicos Customer Service Manager.


